-
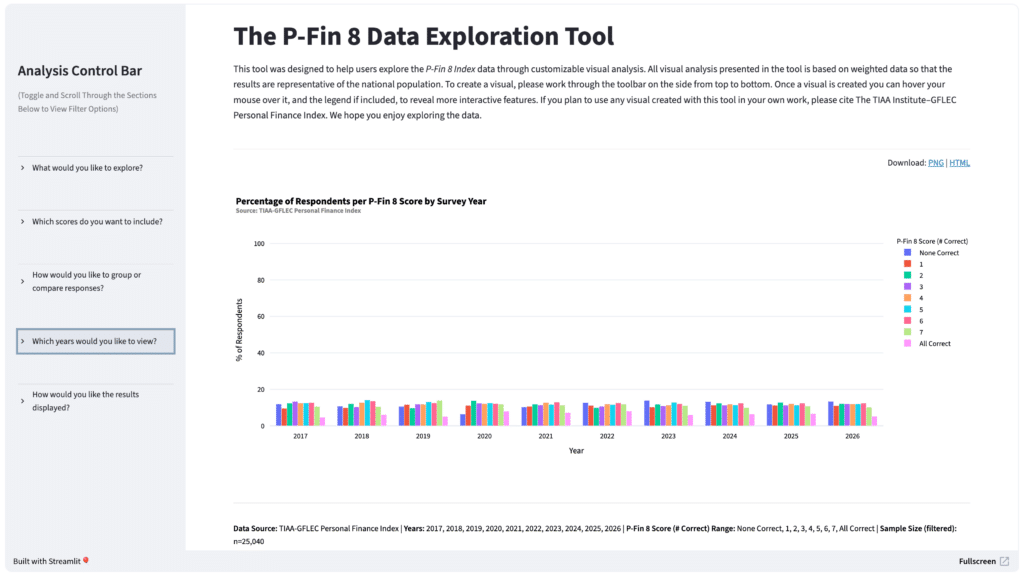
The P-Fin 8 Data Exploration Tool
This tool was designed to help users explore the P-Fin 8 Index data through customizable visual analysis. All visual analysis presented in the tool is based on weighted data so that the results are representative of the national population. To create a visual, please work through the toolbar on the side from top to bottom. Once a visual is created you can hover your mouse over it, and the legend if included, to reveal more interactive features. If you plan to use any visual created with this tool in your own work, please cite The TIAA Institute–GFLEC Personal Finance Index. We hope you enjoy exploring the data.
-
The TIAA Institute-GFLEC Personal Finance (P-Fin) Index
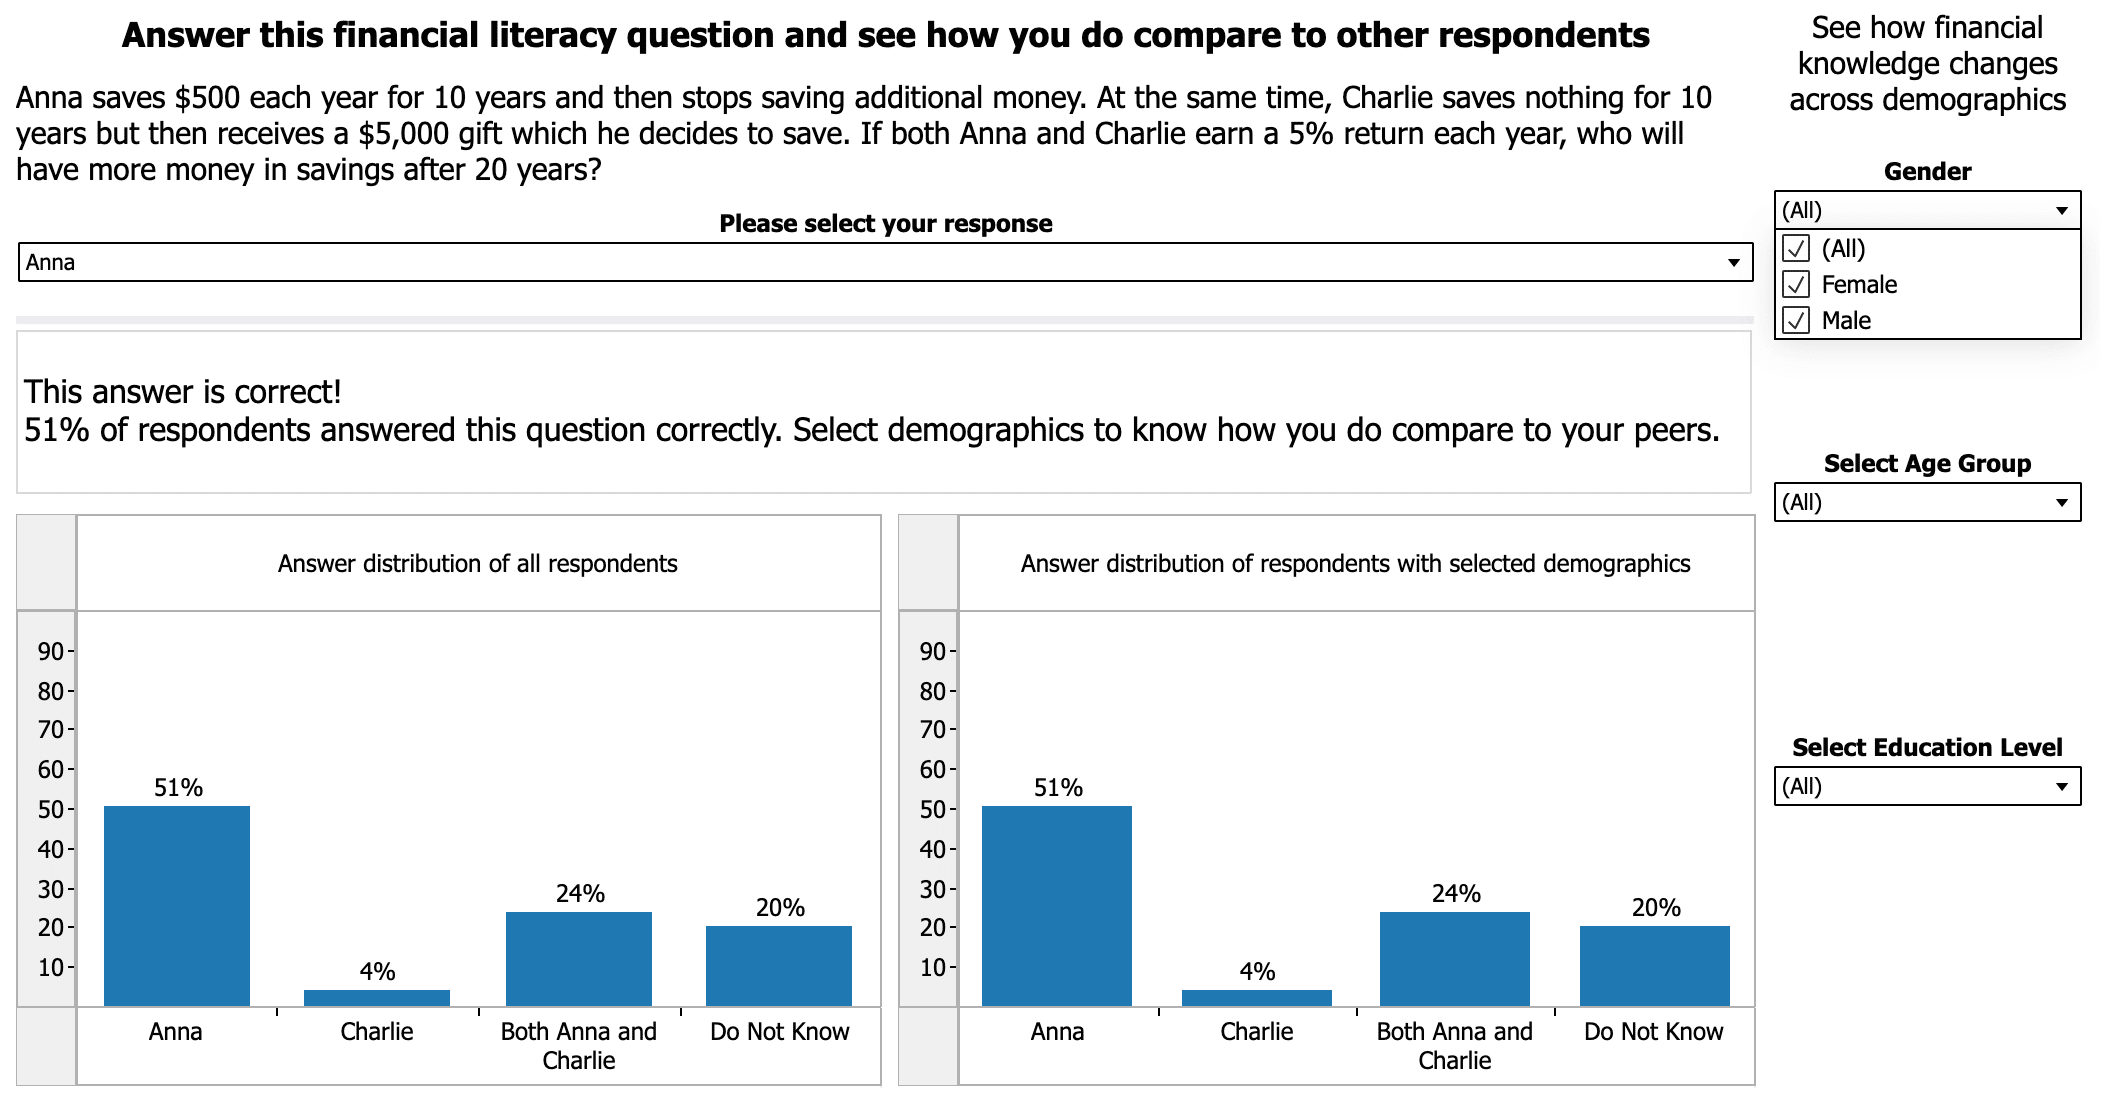
This interactive visualization examines financial literacy across eight areas of personal finance in which individuals routinely function: Earning, Consuming, Borrowing, Saving, Investing, Insuring, Managing Risk, Go-to Info Sources. For more details, please refer to our study “The TIAA Institute-GFLEC Personal Finance Index: A New Measure of Financial Literacy.”
-
Student Loan Repayments
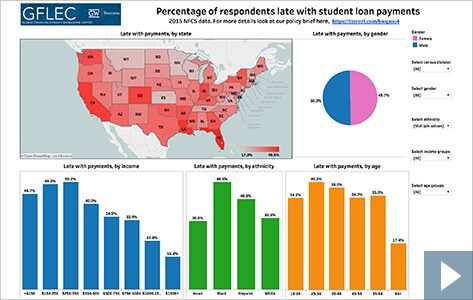
This interactive visualization provides a breakdown of statistics on student loan debt repayment using data from the 2015 National Financial Capability Study. For more details, please refer to our study “Student Loan Debt in The US: An Analysis of The 2015 NFCS Data.”
Visit Dr. Annamaria Lusardi's website to see additional research ➤